Phobrain
Image Analysis 4 - Siamese network comparison of histograms
Image Analysis 3 - Poincare spherical distance
Starting point (now gone, maybe will be replaced?): Train a Siamese MLP on pairs of digits from the MNIST dataset.
Goal: match my taste in image pair selection, using various image histogram methods applied to ~30,000 selected pairs of images to train Siamese neural nets, initially 5x Dense Relu with dropout, then convolutional nets, using Keras with Tensorflow, from 16K photos, including photos from Bill, Ellen and Raf & Skot.
Example Training Pairs (click on Phob->Search Mode: AI, then 'C' button to see another training pair.)
Example NN Matches
Comparison of pairs matching 'tower' ordered by by a single model's predictions, Linear [Hue * Saturation 48x48 + keyword vector]:
Top matches | Bottom matches
Pair space is roughly 79M pairs, and 0.125% of it has been explored, selecting pairs from proposals generated from color distances using a variety of histogram types, and a keyword distance function (yielding 20% useful pairs).
Training Data Curated pairs used for the training data can be seen by going to the View page, where by default another training pair will be shown each time you click on a photo.
Live Demo On the View page, choosing the Phob->Search Mode: AI option will bring up Σ0/ Σ𝞍/ Σ0𝞍/ Σk/ ΣΣ/ Σx icons, along with some other options for matching (whose functions are revealed by mouseover), notably the pure random one, |. The Σ options choose pairs either by merging results from 5 or more neural nets, or by a higher-level merge of suggestions of multiple groups. Initially, the arithmetic inverse of the nets' distance predictions were used as weights for random selection of a match to a given photo, but to merge nets using different scales, sums of normalized values from different nets are used to derive merged weights, which are similarly used for random selection (the same random auction process used for choosing the ads that appear on web pages, where the cookies and ad budgets determine the weights). This paperlet describes what went into the first three of these options, labeled below as 𝞍0-5.
| Option | Model |
|---|---|
| Σ0 | 5 𝞍0 models: Linear 48x48=2304 Hue*Saturation. |
| Σ𝞍 | 6 models: Linear and Convolutional 48x48 Hue*Saturation (𝞍0,1); Linear RGB 32x32x32=32K (𝞍2); Convolutional 32x32x32 RGB (𝞍3), made without any refinement of the model other than 3D'ing the 2D model and then chopping dimensions until it fit in memory, to see if human effort on the model to improve test accuracy really makes a difference in the visual experience; Convolutional 12x12x12 RGB (𝞍4), with effort put into optimization; Convolutional 24x24x24 RGB (𝞍5), The same net applied to 24x24x24 without further optimization. |
| Σ0𝞍 | 10 models: Combination of the two above; 1 model overlaps. |
| Σk | 30 models: HS48x48 + keywords. Adding a keyword vector to the histogram yields ~5% boost in accuracy, numbers not shown. |
| ΣΣ | 40 models: All models. |
| Σx | Random set of models from {Σ0𝞍, Σk, ΣΣ}. |
Pairs are split into vertical, horizontal groups, with 27M vertical pairs
and 51M horizontal.
Training all pairs and each group separately,
on 50:50 positive:negative cases.
Testing on 20:80 ratio seen in practice.
Cutoff for linear models is adjusted from the original 0.5 to 0.1:
x = labels[predictions.ravel() < 0.1].
0.5 was resumed for the convolutional models.
It seems that the predictions are measures of closeness (0==identical) rather than matches to the 0/1 labels used for indicating not_interesting/interesting, as I originally assumed.
Vertical: train.pos: 14400 train.neg: 14400 test.pos: 1599 test.neg: 7995
Horizontal: train.pos: 13888 train.neg: 13888 test.pos: 1542 test.neg: 7710
Both: train.pos: 28288 train.neg: 28288 test.pos: 3141 test.neg: 15705
Timing: 7 threads used to load files.
Optimizer: RMSprop.
Models
(they can't help it if they are beautiful)
Dense*5
Dense*5 pinch
Dense*5 pinch2
Dense*5 pinch4
Dense*5 pinch3,
HS48: 𝞍0
Conv2d_1,
HS48: 𝞍1
Dense*5 pinch3,
RGB32: 𝞍2
Conv3d_1,
RGB32: 𝞍3
Conv3d_2,
RGB12: 𝞍4
RGB24: 𝞍5
System characteristics
| Notes | Greyscale | Hue*Sat 24 | RGB 12 | Hue*Sat 48 | RGB 24 | RGB 32 |
|---|---|---|---|---|---|---|
| Data set size | 70M | 177M | 231M | 522M | 1.3G | 2.9G |
| Input width | 150 | 576 | 1728 | 2304 | 13824 | 32768 |
| Dense width | 128 | 256 | 728 | 812 | 2048 | 4096 |
| Time to load data + train on 2015 laptop | 2m | 3m | 15m | 22m | - | - |
| Time to load data + train on 1080 ti | 1m | 1m | 1m | 2m | 9m | 25-50m |
| Time to process 79M pairs with gpu (7-thread data read) | - | - | - | 40m (41s) | - | 7h (14m) |
Convolutional models
| Notes | RGB 12 | Hue*Sat 48 | RGB 24 | RGB 32 |
|---|---|---|---|---|
| Input dimensions | 12x12x12 | 48x48 | 24x24x24 | 32x32x42 |
| Batch size | 256 | 1024 | 256 | 128 |
| Time to load data + train 20 epochs on 1080 ti (one orientation) | 1m | 43m | 12m | 36m |
| Time to process 79M pairs with gpu (7-thread data read) | 45m | 140m | 478m | 30h |
Test set accuracy, linear models
(% vert, horiz, both) for various params
Training accuracy 78-100%, usually 98+.
| Model | Notes | Greyscale | Hue*Sat 24 | RGB 12 | Hue*Sat 48 | RGB 24 | RGB 32 |
|---|---|---|---|---|---|---|---|
| Dense*5 | batch 128, epochs 50 (vert, horiz) | 42, 30 | 52, 40 | 48, 48 | 46, 46 | 43, 56 | 49, 43 |
| Dense*5 | batch 1024, epochs 100 | 38, 31 | 52, 38 | 45, 57 | 65, 56 | 50, 55 | 68, 47 |
| Dense*5/pinch | batch 128, epochs 50 | 33, 32, 40 | - | - | 40, 48, 52 | - | 49, 42, 64 |
| Dense*5/pinch | batch 1024, epochs 100 | - | - | - | 75, 55, 64 | - | 48, 58, 60 |
| Dense*5/pinch2 | batch 1024, epochs 100 | - | - | - | 63, 55, 64 | - | 61, 51, 51 |
| Dense*5/pinch3; 𝞍2 | batch 1024, epochs 100 | - | - | - | 52-82, 61, 70 | - | 76, 61, 60 |
| Dense*5/pinch3 | 1024, 100; train both, test v/h (overlap) | - | - | - | 86-91, 83 | - | - |
| Dense*5/pinch3 | 1024, 100; train both, test v/h (no overlap) | - | - | - | 44-55, 40 | - | - |
| Dense*5/pinch4 | batch 1024, epochs 100 | - | - | - | 47-70, 55, 61-68 | - | - |
Test set accuracy, convolutional models
(% vert, horiz)
| Model | Notes | RGB 12 | Hue*Sat 48 | RGB 24 | RGB 32 |
|---|---|---|---|---|---|
| Conv2d_1 | Verticals; batch 1024, epochs 20 | - | 87 | - | - |
| Conv2d_1 | Horizontals; batch 1024, epochs 100 | - | 65 | - | - |
| Conv3d_1 | Verticals; batch 128, epochs 100; Training accuracy 69% | - | - | - | 20 |
| Conv3d_1 | Horizontals; batch 1024, epochs 100; Training accuracy 92% | - | - | - | 26 |
| Conv3d_2 | Verticals; batch 256, epochs 100; Training accuracy 95%, 97% | 30 | - | 32 | - |
| Conv3d_2 | Horizontals; batch 256, epochs 100; Training accuracy 99%, 94% | 30 | - | 27 | - |
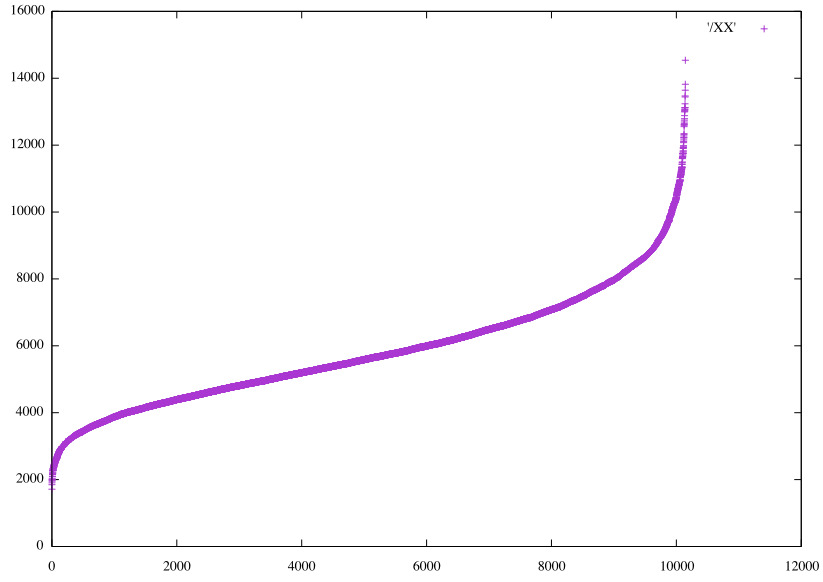
It seems 30% accuracy is about the best that can be achieved, although augmenting the data remains to be tried. How similar are the predictions? Considering the 10 closest matches to the first photo ('1:1') for 5 separate optimizations of the Dense*5 pinch3 on HS48, the components to a Σ0 match. They are all unique. Here the ordering of values for two of the models is shown, then the values of one ordered by the values of the other, then finally, ordered by the values from Conv3d_2 on RGB24.
Ordered values for 𝞍0 match on photo 1:1
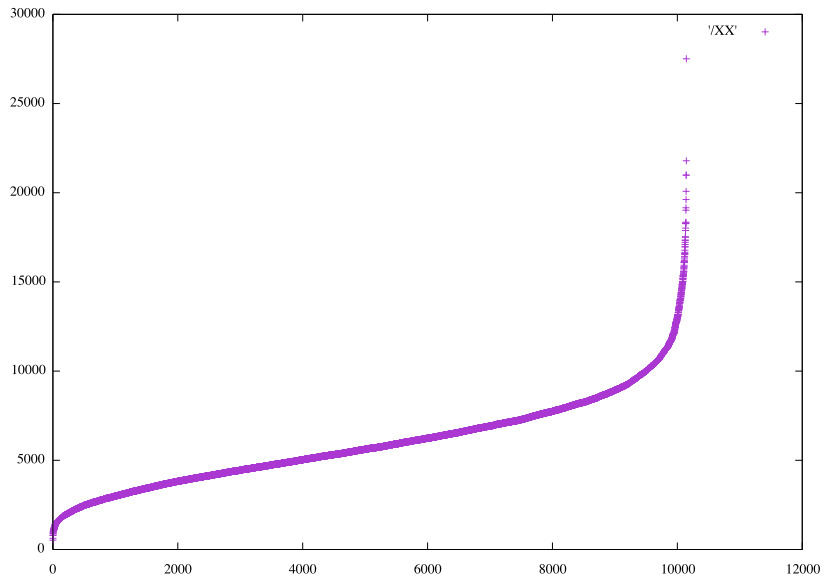
Ordered values for another Dense*5 pinch3 HS48 match on photo 1:1
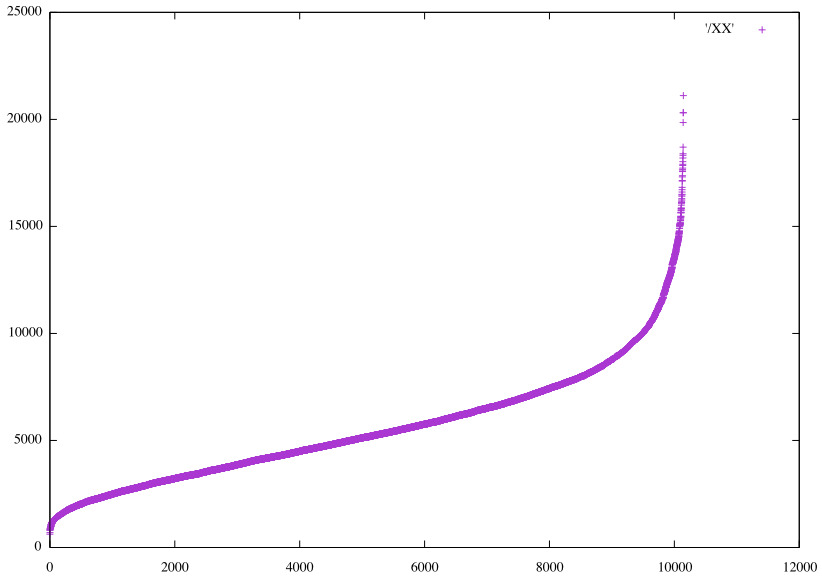
Values for latter Dense*5 pinch3 HS48 sorted by 𝞍0
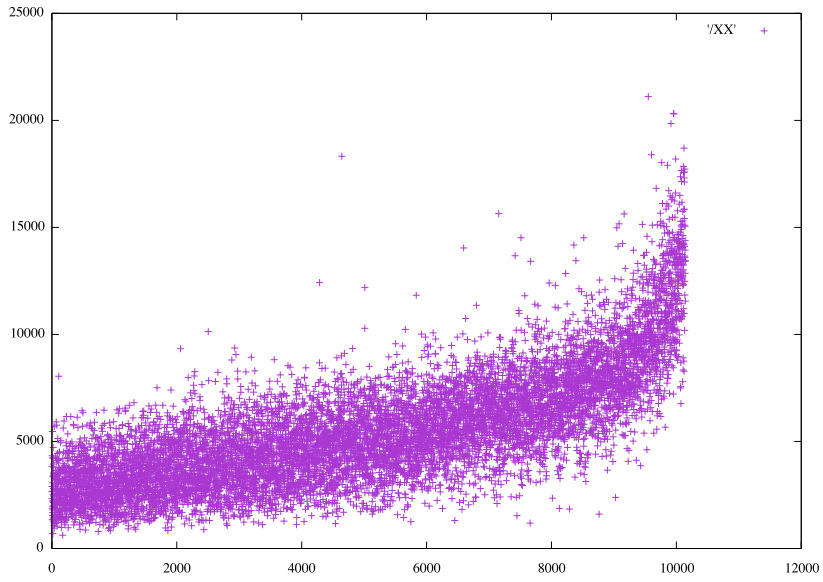
Values for latter Dense*5 pinch3 HS48 sorted by 𝞍5
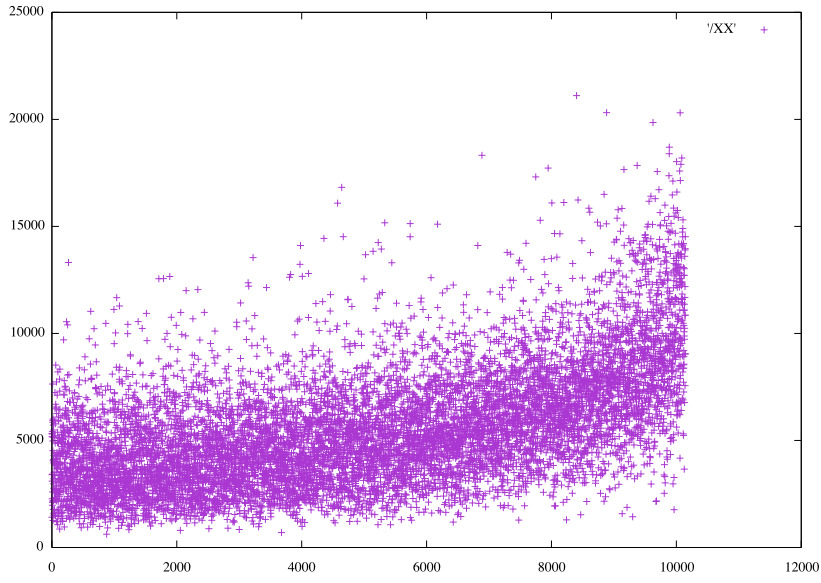
Ordered values for 𝞍5 match on photo 1:1
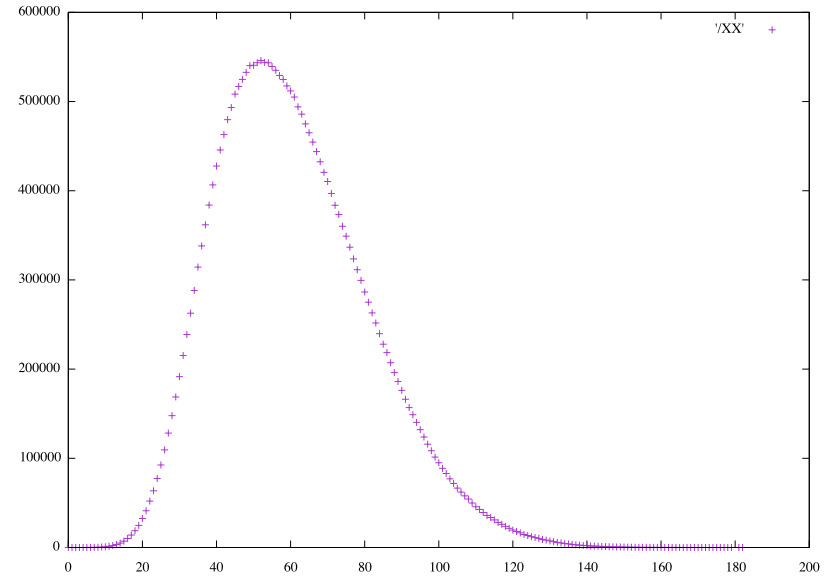
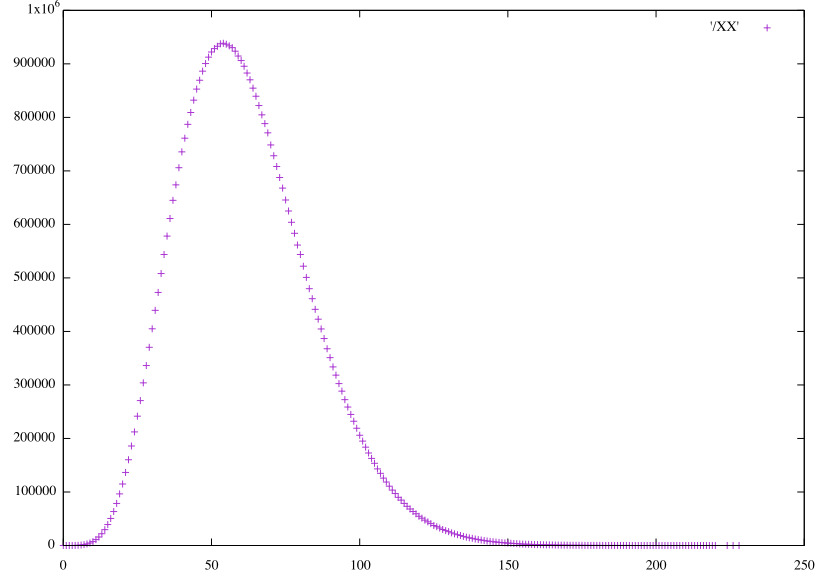
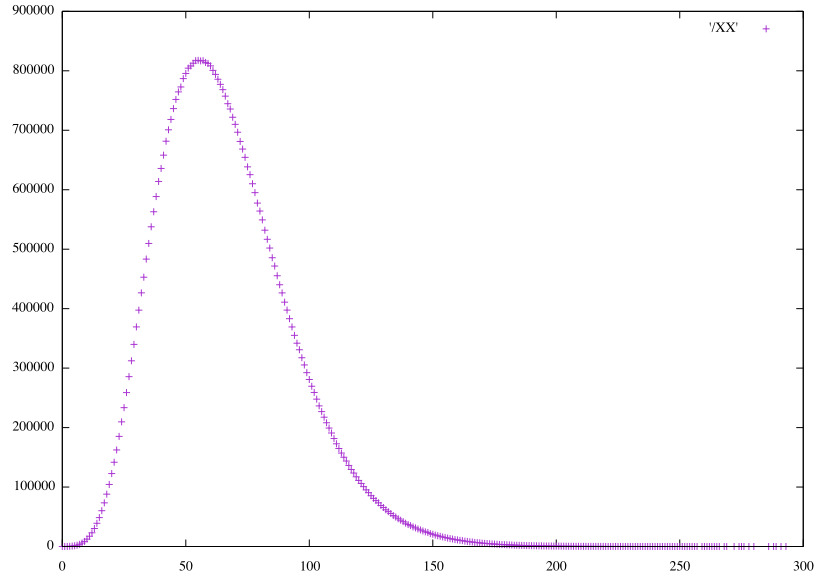
Distributions of the raw predictions, scaled to integers.
Linear HS48 vertical pairs (𝞍0)
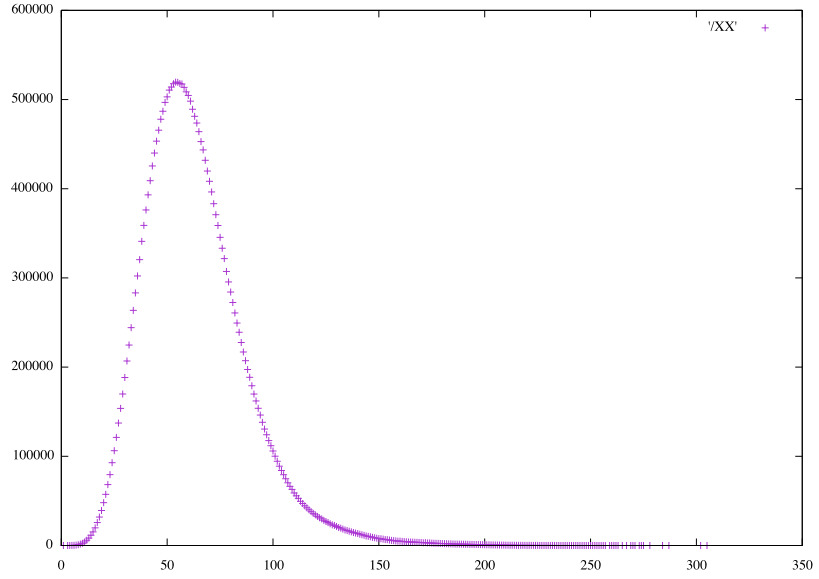
Linear HS48 horizontal pairs (𝞍0)
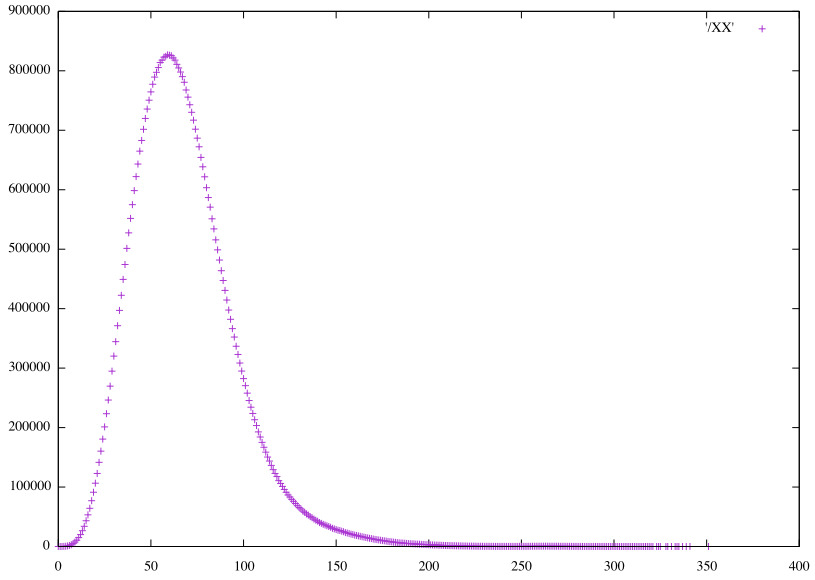
Convolutional HS48 vertical pairs (𝞍1)
Convolutional HS48 horizontal pairs (𝞍1)
Linear RGB32 vertical pairs (𝞍2)
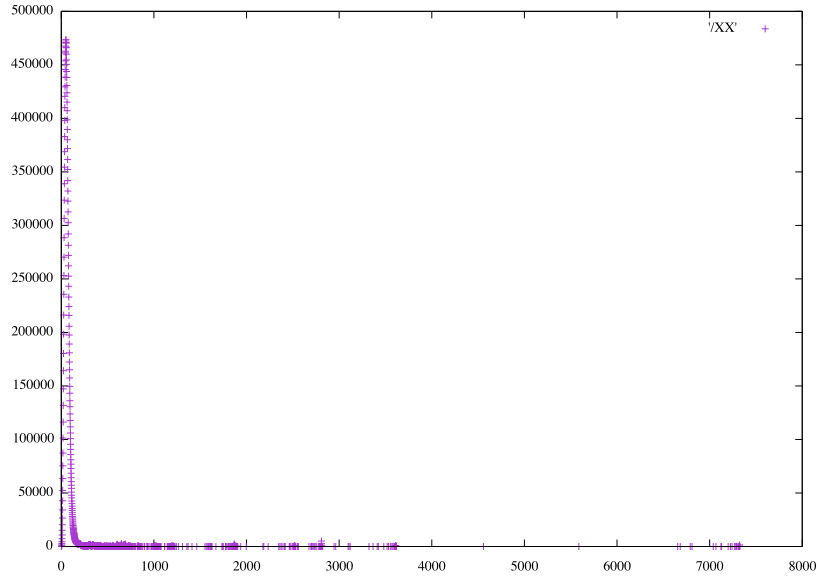
Linear RGB32 horizontal pairs (𝞍2)
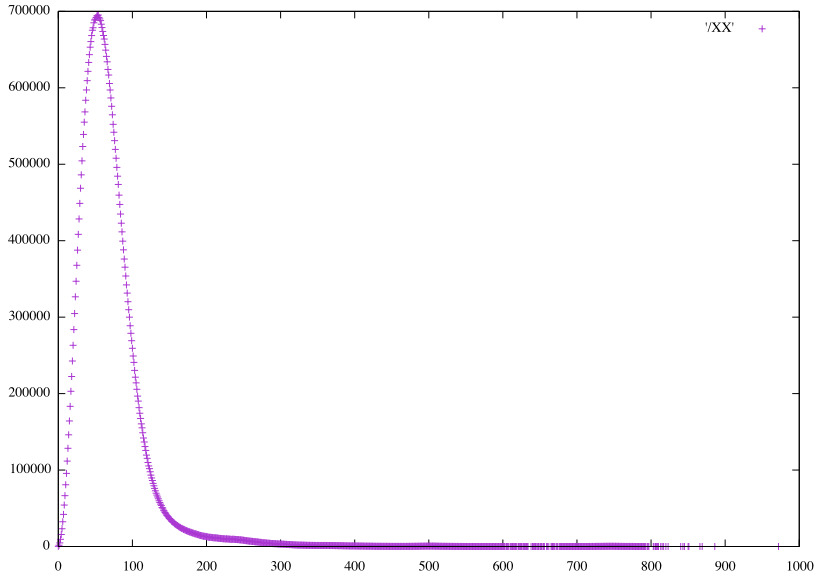
Convolutional RGB32 vertical pairs (𝞍3)

Convolutional RGB32 horizontal pairs (𝞍3)
Software
Histograms from BoofCV.
Neural network: Keras with Tensorflow.
What use to cry for Capricorn? it sails
Across the heart's red atlas: it is found
Only within the ribs, where all the tails
The tempest has are whisking it around.
— Mervyn Peake, Titus Alone